Investing Ideas

1.32 K

It’s been a while since I last did an update of the blog again as I recently joined another firm which keeps me busy, and I was restricted to make too much exposure on the blogging front due to the nature of my role.

In any case, I just wanted to take this opportunity to refresh my spreadsheet model on the intrinsic value calculation on some of the core China related companies that I own, which also has recently been the topic of the chat throughout the media because of the stimulus announcement that was announced.

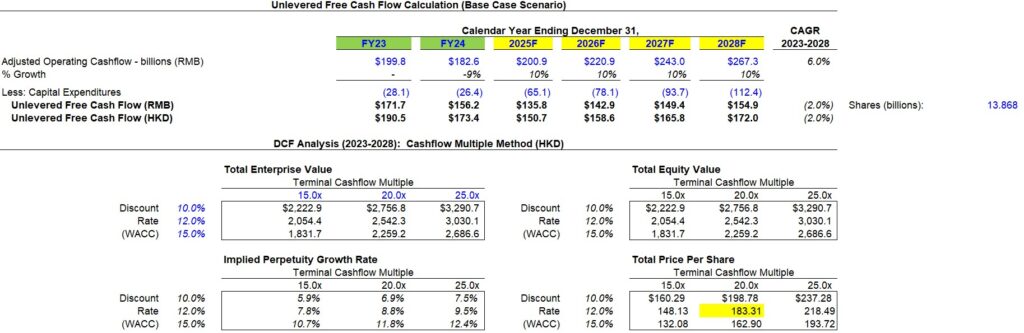
Alibaba Holdings – Intrinsic Value Calculation

I updated my spreadsheet to reflect the latest FY23 and FY24 numbers, and made two major changes to the model.

First, I took out the capex front of the Alibaba Cloud Infrastructure which the company is investing for AI for growth as the huge drop in Q1 FCF was due to that. It will be hard to quantify the future benefits of such investment without doing any deep dive but at this moment, we simply just do not have enough information to do that. Without that component, I am projecting for an organic increase in 10% FCF otherwise during the year.

The second piece which I updated was its shares outstanding which the company has done major share buyback since its announcement a couple of quarters ago, and I projected for the shares outstanding to decline by 10% each year until 2028.


The model returned me an intrinsic value calculation of HKD 183.31.


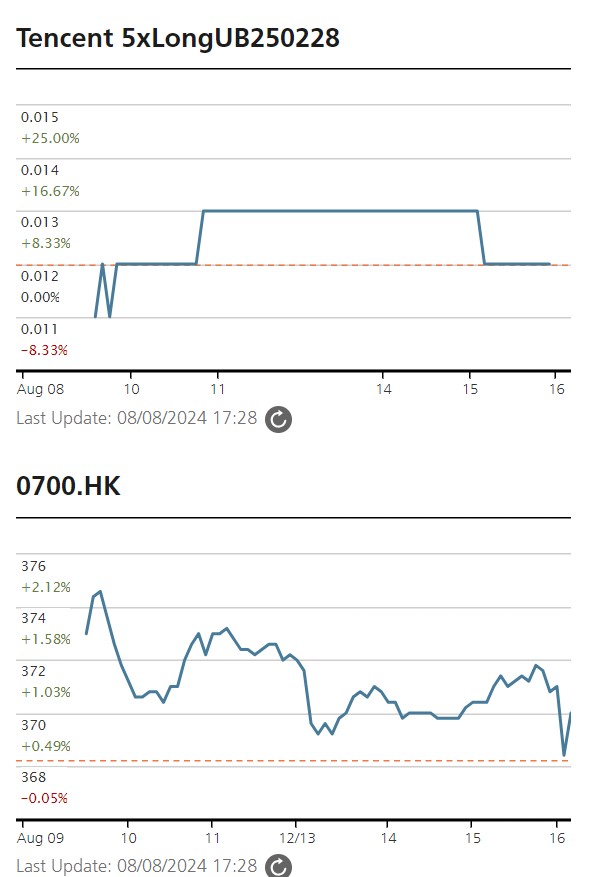
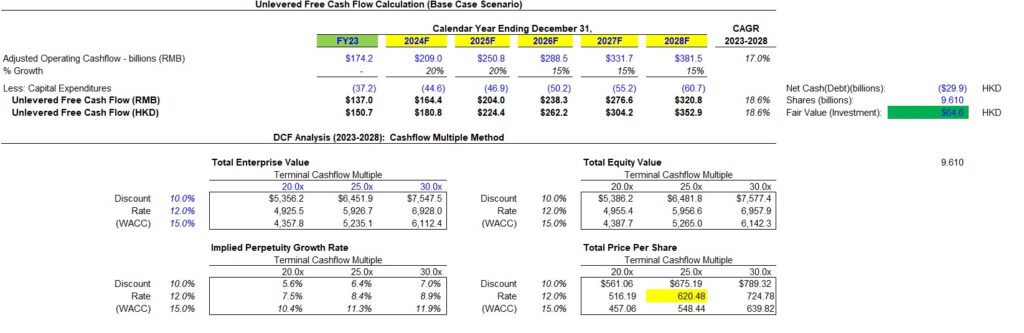
Tencent Holdings – Intrinsic Value Calculation

For years, Tencent has a habit of spending and reinvesting their free cash flow into new businesses and do not maintain a huge chunk of cash on their balance sheet. Recently, they even announced that they will be doubling the share repurchase buyback, which will improve their EPS over time.

These businesses are recorded as part of their equity share of profits and not into the organic model of their operating cashflow so we’ll have to add that in at the end of the day.

As of Q2 FY2024 latest result announcement, the Fair Value of the shareholdings in listed investee companies, excluding subsidiaries, stand at RMB 564.5 billion, which is more than half trimmed down from what it used to be RMB 1.36 trillion around 3 years back. Investors of Tencent might have recalled that they have given out the likes of Meituan and JD shares as special dividend in specie over the years. For RMB 564.5 billion, if we convert it into HKD/share, it is approximately worth HKD64.6 (RMB 564.5 billion x 1.1 HKD / 9.61 billion outstanding shares).

For its operating business, I am projecting a return to organic recovery case scenario which embeds a model of 20% growth for the next 2 years, then 15% for the next 3 years. For the first half of FY24, we are already seeing that moving into reality.

Cashflow multiple of 25x is used for high quality companies growing at the higher end, which I think companies like Tencent fits the bill.

The intrinsic value I get from the model is HKD 620.48. Combining it with the HKD64.6 investment fair value, we get a total intrinsic value for Tencent of about HKD 685.


Ping An – Intrinsic Value

There are 3 things that stand out to me for Ping An in FY2023.

First, the property market totally wrecked the entire China and affected insurance and banks with exposure to property companies like Ping An Insurance. Provision for impairment has gone up and solvency ratio has also gone up. Net profit for its property and casualty insurance segment has plunged to just under RMB 9 billion. Non-performing loans rose up to 1.22.

This should recover well into FY2024 now that they have kitchen-sink the worst scenario and this asset management segment should recover by at least RMB20 billion into FY2024.

Next, the Life and Health insurance business has recovered well and look to trajectory growth back in FY24 after the company putting in efforts in the past few years the number of retail customers and agent per customer ratio served.


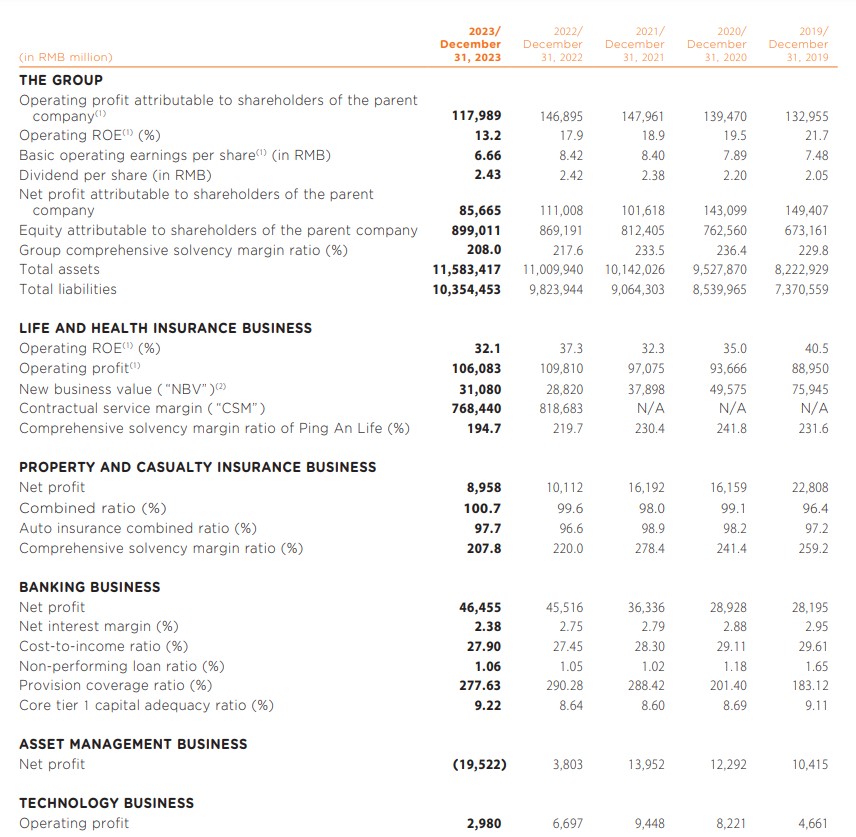
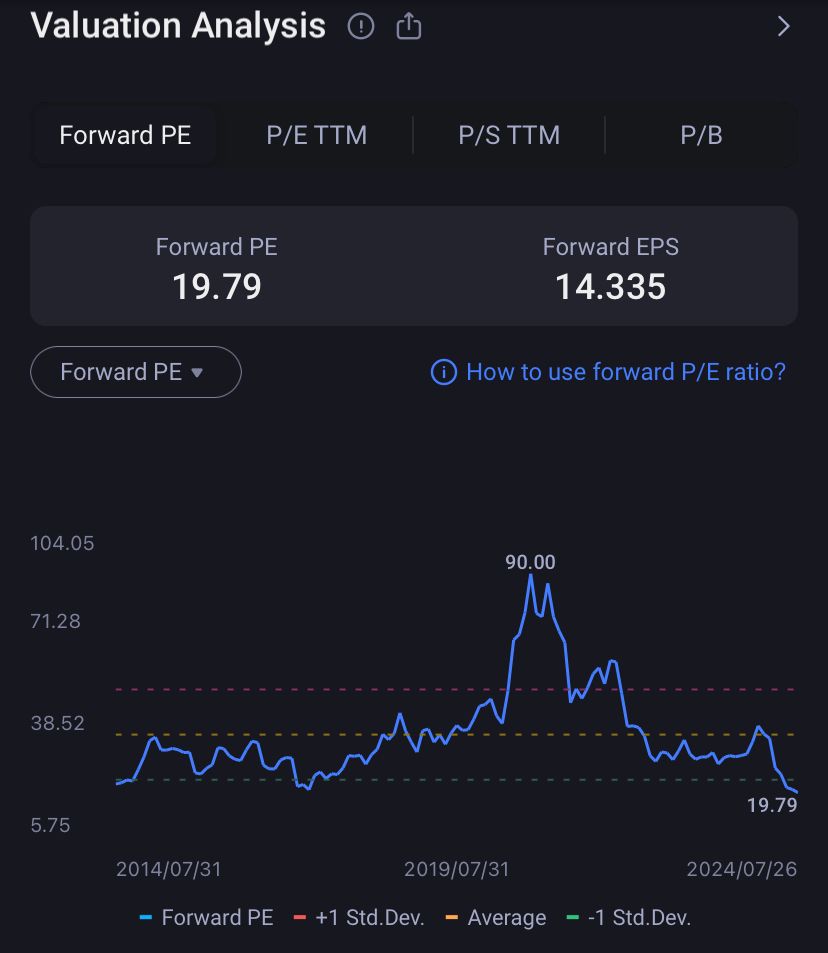
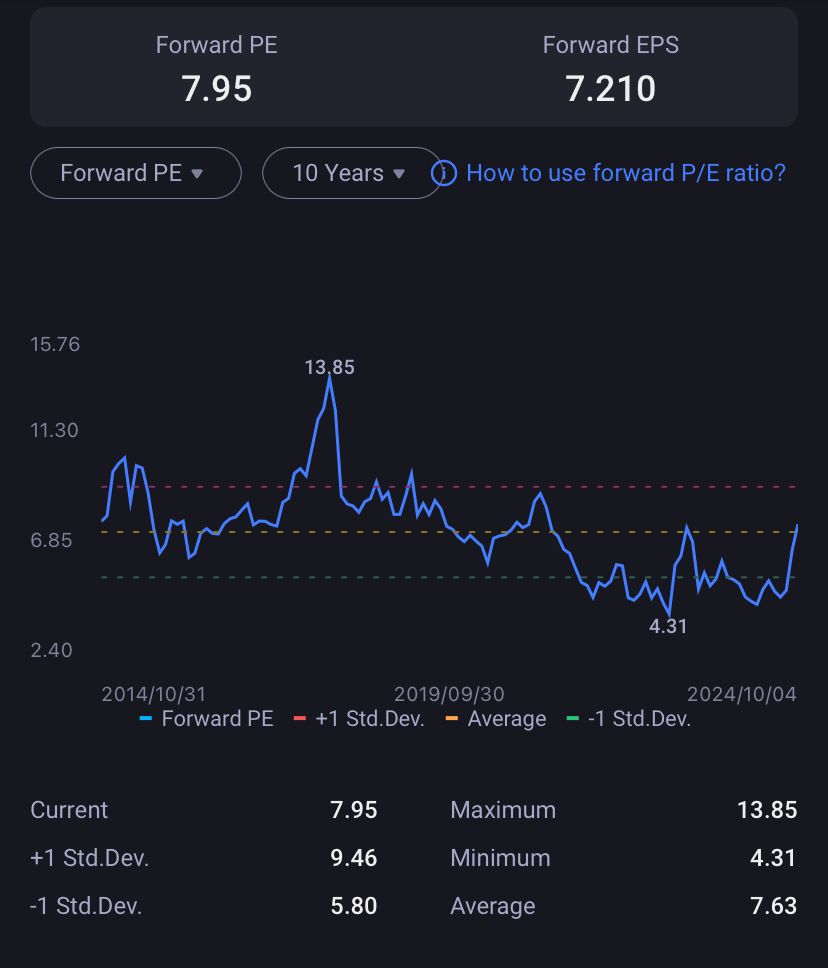
For FY24, I do expect the company to return to its RMB8 EPS at a forward PE Ratio of around 8x. This will put the company at a share price expectation of around RMB 64 or HKD 70.8.

If the company can expect further growth to commence, we can even plug in further PE expansion to +1 SD deviation which will put the intrinsic value even higher.


3 Ways to Play the China Market

There are 3 ways to play the China market for those who are somewhat keen in getting back into this market.

First, you can directly buy into your position when market opens next week. This will give you a direct exposure to ride the upside (and also downside) if there’s any.

Second, since the trend seems to be heading into strength, you can write a put option for these shares, as they may continue their way higher when market opens next week. If market declines into correction, you can also keep your premium and obtain your shares at your desired lower prices.

Third, If you are already having a position, you can write a covered call for these positions at the intrinsic value strike price mentioned above. The premium is juicy since it’s been pushed up quite a bit over the last week and you might get additional premium in return.

With many companies looking at the resistance, and with China market going to reopen next week, it will be a bull vs bear fight and another one to watch for next week.

Read more

Are you ready to prove your trading skills and compete against the very best fund managers out there in the industry? Whether you’re a seasoned pro or just starting out, this is your chance to shine in the Active Trading Tournament 2024 which will be held from the 12 – 30 August 2024.

The tournament consists of 2 rounds:

1) Tournament Trading Round 

2) Top 5 Finalists Pitch Round

The top 5 traders with highest portfolio returns in the tournament trading round will be invited to The Finale Pitch in Singapore on 14 September 2024 to do a live pitch on stage in front of panel of judges to win cash prizes.

A minimum of four trades for each participant is also required to be the top 5 traders.

This year, InvestingNote is partnering with UBS and Societe General for this Active Trading Tournament.

As with the other previous years, the tournament focuses on the trading of Daily Leverage Certificates (DLCs) which allows both short & long to obtain the maximum benefits gain for the participants.

For those who are not too familiar with how DLCs work, it is essentially an exchange-traded financial instrument that provides leveraged exposure to the performance of an underlying asset, such as an index, stock, or commodity, on a daily basis. These products are designed to amplify the daily returns of the underlying asset, either positively or negatively, depending on the direction of the leverage.

So regardless of whether you’re holding Long or Short views on the market, you’d be able to profit from taking the respective DLCs position in the market.

Here’s some of the important considerations when trading a DLC.

Leverage Mechanism:

DLCs offer a fixed leverage factor, typically ranging from 3x to 7x. For instance, if a DLC offers 5x leverage and the underlying asset increases by 3% in a day, the DLC’s value would increase by 15%. Conversely, if the underlying asset decreases by 3%, the DLC’s value would decrease by 15%.

Daily Reset:

The leverage is applied to the daily return of the underlying asset, meaning the DLC resets its leverage daily. This is a critical feature because it means the DLC’s performance over a period longer than one day may not directly correspond to the underlying asset’s performance multiplied by the leverage factor. This is due to the compounding effect.

Compounding Effect:

The compounding effect can lead to significant differences between the expected and actual returns over multiple days, especially in volatile markets. For example, in a volatile market, the compounding effect might cause the DLC to underperform or overperform compared to what a simple multiplication of the asset’s performance by the leverage factor would suggest.

This tournament is FREE for all to join, so why not pit your chance to win a few dollars and who knows you might just come out on top.

Click here to join the competition and register asap!

Read more
1.04 K

$MCD 

If you haven’t heard of McDonald today in this era, you are probably living in a cave.

Founded in 1940, the chain business was once a hamburger stand, which later turned into a very successful franchise business.

At its core, McDonald Corporation today is one of the world’s largest fast-food chains, known for its burgers, fries, and various other menu items. The chain operates thousands of restaurants globally, serving a vast array of food and beverages to over 69 million customers daily in over 100 countries.

What many people doesn’t quite know or realise is that the corporation is also a substantial real estate player in the business, and has generated massive rental income as part of their revenue generating strategy in the last few decades.

As a franchise business operator, they would often lease the property together with the business operations to the franchisee, allowing them to earn money not only from the food and beverage sales but also from the rental income it gets from its extensive property leasing business.


A Reflection of Inflationary Trend Indicator

As one of the leading indicator for inflationary trend used across by many case studies globally, due to its significant presence globally, McDonald’s pricing strategy, driven by changes in raw material costs, labor expenses, and operational costs, provides a clear reflection of inflationary trends.

Given McDonald’s vast number of locations and consistent pricing strategy, changes in its prices can reflect broader economic conditions, making it a useful gauge for inflation. Prices of key ingredients such as beef, chicken, and potatoes are influenced by market conditions. Increases in these costs due to supply chain issues, weather events, or geopolitical factors can drive up menu prices.

McDonald’s frequently adjusts its menu prices in response to changes in input costs such as labor, raw materials, and rent. As these costs rise, menu prices are typically increased to maintain profitability.


When Will The Streak End?

Before its latest Q2 earnings which was announced earlier this week, McDonald’s was coming off an impressive 13 consecutive quarter streak of successive sales growth – despite the higher inflation over the past 1-2 years.

For its recent Q2 earnings which they announced earlier in the week however, they generated $6.49 billion of sales, which was flat from the same period comparable last year. This is also below the market consensus which was expecting to generate around $6.6 billion.

Across many segments, they reported falling and weakening metrics – including US Sales which slightly dropped 0.7% YoY, International Operated markets sales dropped 1.1% YoY, and International Licensed markets sales dropped by 1.3% YoY.

On its bottom line profitability, McDonald also reported lower operating income which fell by 6% YoY, and net income which fell by 11% YoY.

Despite the blip this quarter, McDonald is still looking to expand its operating presence by adding 1,600 net new restaurants in 2024, where it is expected to increase its sales incrementally by around 2%. The long term targets beyond that will be around 2.5% rate. This is based on a 4-5% gradual increase in net new restaurant growth, targeting 50,000 units globally by 2027.

The management also remains committed to its “Accelerating the Arches” Strategic Plan – which consists of these three key pillars:

(M)aximising Marketing:


  • Driving Scale through Marketing

  • Maximising Return on Investment

  • Creating a more personalised approach to value – a good example of this is their very popular $5 meal


(C)ommit to the Core:


  • Piloting a new larger burger equity

  • Scaling McCrispy to nearly all the markets by end 2025

  • Extending McCrispy into wraps and tenders, delivering an additional point of chicken share

  • Deploying Best Burger to nearly all markets by end 2026


(D)ouble down on the 4Ds:


  • Deploying Ready on Arrival technology across the top 6 markets by end 2025

  • Reaching 250 million 90-day active loyalty members and $45 billion in annual loyalty Systemwide Sales by end 2027

  • Generating 30% of delivery sales through integrated delivery by end 2027

  • Surpassing 50,000 restaurants globally by end 2027


DCF Valuation:

We did a DCF projection based on the outlook information which was given by the management.

We projected for an incremental 2% increase in FCF in 2024 followed by 3% and then 4% next year, and then a terminal growth of 5% thereafter. This is based on the assumption that they will hit their objective of 50,000 restaurant goals by 2027, and also operating margin expansion beyond 47% currently, which is one of their “Accelerating the Arches” strategy plan.

Their current P/E multiple stands at between 21-23x while Price to FCF is at 10.4x. We will use the average of 25x for the purpose of this exercise.

We came up to an intrinsic value for McDonald to about $212, which is below the current market price of $276. Unless we see discretionary spending particularly in the US rebounding stronger, there will be risk in the trade-off.

Read more
1.52 K

$CMCSA $NKE $DKNG 

The Olympics fever are finally back here again!

According to a study by the National Bureau of Economic Research, they found that stock markets in host countries particularly often show positive abnormal returns in the lead-up to the Olympics, reflecting increased economic activity and investor confidence.

The Grand Paris Express Project is a prime example, with infrastructure being built for the events that will substantially benefit the citizens and its own people even way after the Olympics ends eventually.

Major events such as the Olympics heightened consumer awareness and engagement particularly in sponsored business activities through athletes wearing logos on their shirt or rackets, or banners displaying across stadiums.

Here are the 3 stocks that are likely to go straight for the gold medal during the Olympics:

1.) Comcast Corporation (“CMCSA”)

As the owner of NBCUniversal, which holds media rights to the Olympics, Comcast will benefit from extensive coverage and increased viewership during the Olympics event no doubt. This is the 18th time NBCUniversal will be a broadcaster of the games.

This year will be extra special however, as viewers can watch on both the television channels as well as the Peacock streaming service, which will in turn attract more viewers.

Attracting viewership and gaining new subscribers is an important metric for Comcast. Its media segment, which includes television and streaming on Peacock, increased 2.1% in the second quarter from the prior year.

Apart from viewership, Comcast is also likely to gain from substantial advertising revenue during this event.

Based on the last Tokyo Olympic event, NBCUniversal reported over $1 billion in national television advertising revenue, which gave them a nice boost to their brand exposure to the audience.

2.) Nike Inc (“NKE”) and Adidas AG (“ADDYY”)

The two leading sports retail players are dominating the sponsor for the athletes’ footwear and apparels.

When these athletes who compete in the Olympics wear their logos and products during high-profile events that are shown to billions of people in the world, it creates positive associations and visibility for the brands – leading to increased sales and consumer loyalty and engagements thereafter.

The emotional highs and lows of the Olympics create lasting memories for viewers, and brands that are prominently featured become part of those memories, fostering long-term loyalty.

The Olympics also tend to attract a younger audience, and strong visibility can help Nike and Adidas appeal to and capture the loyalty of younger consumers.


Their YTD performance though are two different tales altogether.

While Adidas has gained ~30% from the start of the year, Nike has lost ~30% in the opposite direction.

Nike is currently trading at a TTM P/E of 19.4x, but has guided for a weaker FY25 as it expects revenues to fall by mid single digits due to weaker spending from China.

3.) Draftkings Inc. (“DKNG”)

DraftKings is a major player in the online sports betting which stands to gain significantly from the Olympics through increased betting volume and awareness.

Major international events like the Olympics draw in both regular and casual bettors, significantly increasing the betting volume on DraftKings’ platform​. It even allows the likes of placing a bet on events such as fencing, archery, and track and field – events that are likely to garner visitors’ interest apart from the usual soccer and basketball matches.

As part of its new acquisition strategy, DraftKings also run targeted marketing campaigns and promotions offering bonuses and free bets to new users who sign up during the Olympics.

Draftkings are currently trading at a below than average P/S of 4.5x.

Read more
2.04 K

$LULU Lululemon Athletica Inc (“LULU”) Has Never Traded This “Cheap” From a Valuation Standpoint


Lululemon has caught the attention of many value investors lately, as it has fallen almost half from the start of this year (since hitting the peak in Dec last year) due to the slower growth and weak spending consumption, impacting many other consumer discretionary and luxury stocks particularly this year.

With the stock currently trading at the ~$250 range as of writing, can we see this an opportunity to purchase a quality business at a reasonable valuation? Is this an appealing opportunity for investors to initiate a position in this stock? Let us dig in more to find out.


Business Overview

Lululemon Athletica, is a Canadian athletic apparel retailer known for its high-quality yoga pants, leggings, and other athletic wear. Founded in 1998 by Chip Wilson in Vancouver, Canada, Lululemon initially focused on yoga wear before expanding its product line to include a variety of athletic and casual clothing, as well as accessories for men and women.

Lululemon is renowned for its high-quality, durable fabrics and innovative designs, which cater to both performance and comfort.

The company promotes a healthy and active lifestyle, often integrating mindfulness and wellness into its brand ethos.

From a community and retail branding point of view, Lululemon frequently hosts free yoga classes and other fitness-related events in its stores and local communities, fostering a sense of community and loyalty among its customers.


Since its founding, Lululemon has grown significantly, with stores across North America, Europe, Asia, and Oceania. The company continues to expand its product range and global presence.

Known for its excellent customer service, Lululemon emphasizes creating a personalized and engaging shopping experience both in-store and online.

Power of Three 2x Strategy

The “Power of Three x2” strategy refers to Lululemon’s ambitious growth plan initially laid out by CEO Calvin McDonald. This strategy focuses on three key areas for driving growth, with an aim to double the company’s revenue. The primary components of this plan consist of:

Product Innovation: Lululemon aims to continually innovate its product lines. This includes expanding the range of offerings in both men’s and women’s apparel, as well as exploring new categories such as self-care and footwear. The focus is on leveraging advanced fabrics and design technology to meet the evolving needs of customers.

Guest Experience: Enhancing the customer experience is central to this strategy. Lululemon plans to deepen its relationship with customers through personalized services, in-store experiences, and digital engagement. Initiatives like community events, fitness classes, and a robust online shopping experience are part of this focus.

Market Expansion: Lululemon seeks to grow its global footprint by expanding into new markets, especially in regions like Asia and Europe. The strategy includes opening new stores and increasing brand awareness through localized marketing efforts.

The “x2” aspect refers to the company’s goal of doubling its revenue, building on the success of the initial “Power of Three” strategy. By doubling down on these core areas, Lululemon aims to significantly increase its market share and achieve sustained growth.


We can see that in the first quarter of its recently announced results last month, the company has done relatively well on the three aspects of their strategies, all delivering positive results.

International markets, especially the China Mainland market, contributed 14% of the total net revenue for the company, and has increased 45% year on year. The Rest of the World contributed 13% of the total net revenue, and has increased 27% year on year.

They have executed the China market very well, especially considering that Nike’s apparel impact from Greater China only contributed a 10% increase year on year, while footwear only increases by a mere 2%.

The North America contribution is the massive worry though, as it has only grown by 3% year on year, and this region contributed the highest margins out of all the markets they are operating.

Overall, gross margins were almost flat at 57.7% of net revenue, versus 57.5% of net revenue the previous year.

Lululemon has also been trying hard to pivot their business towards launching more products for the male population, but it is one which I am just not convinced enough that it will move the needle for them, especially when there are heavy competition out there in sports apparel for male dominated.

Valuation

Today’s share price is equivalent to its share price back then during the peak right before Covid hits back in Feb 2020, but it’s worth to note that its Earnings Per Share (EPS) has grown ~3x from then till now, which objectively speaking comparatively it does look cheap at the moment.

Currently, Lulu trades at a trailing Price to Sales of 3.7x, a trailing Price to Earnings of 23x, and a forward Price to Earnings of 19.7x. Comparatively speaking, Lulu has never traded at such a cheap valuation based on historical perspective.


The million dollar in question is about how much Lulu can successfully execute their “Power of three 2x” strategy and how fast they can move to grow their presence in market share.

There will be headwinds from a slower consumption and increasing competition that might derail their plans like any other business.

While Lulu has guided for a 11-12% projection growth for next year, boosted by the +35 to 40 net new company-operated stores projections in 2024, this is much slower than the growth the company used to grow at in the past.

The problem with valuation multiple is when the growth slows down, the valuation multiple gets downgraded as well, so you get a double whammy from a slower EPS growth plus the lower multiples. The same goes on the other direction where the company starts registering higher growth, and higher multiples will apply.

We run a DCF projection based on a conservative 10% growth rate from today all the way through 2028.

The $1 billion share buyback program approved by the board will help reduce the company’s outstanding shares and increase its EPS over time.

At the 20x multiple, the company’s intrinsic value is worth $373, which is close to a 50% margin of safety from the current share price of about $253.

Even if we had applied a lower multiple of 15x, the company’s intrinsic value is still worth $302, which is still a decent 20% margin of safety away from the current share price.


Because the company is trading at such a depressed valuation at the moment, I think there may be opportunities for value investors to come in for those interested in this space.

The biggest risk remains however whether Lulu can sustain and grow its brand name and become a major powerhouse like Nike one day.


Read more
1.09 K

https://www.3foreverfinancialfreedom.com/2...

$YIXIN GROUP LTD(2858.HK) 

Yixin Group Limited (HKG: 2858) shares have had an impressive past couple of months, gaining +16.2% YTD after a shaky period beforehand. This outperforms the HSI index which at the moment YTD has only gained +2.5%.

The stock is currently under consolidation mode for about a month now going directionless.


With the recent rebound in share price, there still wouldn’t be many who think that Yixin Group’s Price to Earnings ratio of 7.5x is worth a mention when the median average Price to Earnings for the sector industry is about 18.5x.

One possibility for the relatively moderate P/E is because investors might not be confident of the company’s earnings going forward. The stock market is usually forward looking so investors can only say with confidence once they see a clearer growth direction going forward.


Business Overview

Yixin Group Limited is a prominent player in China’s online automobile finance market. Founded in 2014 and headquartered in Shanghai, Yixin operates an extensive online platform that facilitates automobile transactions and financing. 

The company operates through two main segments: the Transaction Platform Business, which primarily supports auto loans through partnerships with financial institutions and offers additional services like SaaS and guarantees; and the Self-operated Financing Business, which provides direct auto finance solutions including leasing and sales-and-leaseback services.

Yixin’s platform, comparable to e-commerce giant Taobao, offers a comprehensive suite for buying, trading, and financing vehicles online. This model has driven significant growth, highlighted by their successful IPO in 2017, which raised HK$6.77 billion and became one of Hong Kong’s hottest IPOs​.

The company has been backed by major investors including Tencent, JD.com, and Baidu, which collectively hold substantial shares. Yixin’s revenue streams are diversified across facilitating transactions, offering financial leasing, and expanding into related tech services.

Despite the broader economic challenges in China, Yixin has focused on staying within its core competency of auto finance, recently divesting from a joint venture that was expanding beyond auto-related services. This strategic focus has allowed Yixin to continue growing, particularly in the electric vehicle (EV) financing sector, which saw a significant year-on-year increase in loan facilitation​.


Competitive Landscape of Auto-Financing

The auto-financing concept is not new and has in fact been around for decades.

Just like purchases of other big-ticket items such as housing, banks would traditionally be the biggest beneficiaries of such financing, given the nature of its business.

There are generally four types of auto-finance providers:

i.) Banks or Financial Institutions


ii.) Automaker backed auto finance companies


iii.) Auto dealer backed auto lease companies


iv.) Online auto transaction platforms

Let us take a look into each of these providers.

Banks, for obvious reasons, enjoy the advantage of the lowest cost of funding. 

While banks have their own networks to access customers, their focus is usually not towards sourcing and they would rely on third party platforms or providers to refer customers to them. Furthermore, banks typically take longer for approval as their processes are a lot more stringent due to requirement.

Compared to banks, automaker backed auto finance companies or auto dealer backed auto lease companies have usually higher cost of funding, but they are well distributed within their own network and can even cross-sell other financial services other than cars, for example personal loans or car insurance, etc.

The biggest advantage of an online auto transaction platform is the technology behind the big data capability that allows them to not only source for potential clients, but also conduct and analyse the applicants’ creditworthiness, process documentation, provide a more friendly efficient end-to-end process, and is usually more lenient towards individuals with lesser than desired credit score.

Where is the Opportunity?

For the fiscal year 2023, Yixin Group reported notable financial performance.


The company achieved a revenue of ¥6.7 billion, which is an impressive +29% YoY growth, with a gross profit of ¥3.7 billion.

Net income for the year amounted to ¥555 million.

Additionally, the company’s earnings before interest and taxes (EBIT) were reported at ¥1.5 billion.


The company continued to earn a healthy gross profit margin despite the tightening in the net interest spread this year.

One of its strategies for this year is to tap into the lower-tier cities as the company believes it is still relatively untapped in the NEV segment. This gives them a projection target of 16% for the second-tier cities and 67% for the third-tier cities and below.


It is also looking to invest heavily into the fintech side of the business by investing in auto-financing platform that will allow them to tap into the mass market before hunting for the premium market share. The company pledges to spend as much as 50 billion Yuan to make this happen in the next 2 to 3 years.

Turning to the outlook, the next 2 to 3 years should continue to allow them to generate growth of ~20% per annum while the industry is forecasting an expansion of about 16% in the market.

We should see Yixin Price to Earnings reverting back closer to the industry average which even at 10x forward Price to Earnings would put their market cap at approximately double to where they are today.

Read more
1.67 K

$CRWD$PANW$SCrowdStrike Documented Worst Day as Outage Could Be World’s Largest Ever

https://www.3foreverfinancialfreedom.com/2...

Read more

$NFLX Is Netflix Cheap or Expensive At This Price?

https://www.3foreverfinancialfreedom.com/2...

Read more

Doing a review on Cash Boost Account for contra trading traders.

https://www.3foreverfinancialfreedom.com/2...

Read more
2.26 K

3 Sectors that will benefit the most from an interest rate cut sector rotations play.
$NikkoAM-STC Asia REIT(CFA.SI) $XLU $XLY

Read more